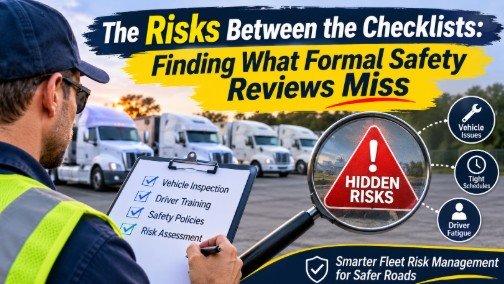
A fleet passes every scheduled inspection. Its policies are current, its drivers are trained, and its annual risk assessment is filed. Yet over one quarter, three vehicles are scraped at the same customer’s loading dock, two drivers mention that the new appointment windows leave no time for a proper walkaround, and a mechanic notes that brake wear on one route is running ahead of schedule. None of these items breaks a rule. Together they describe a risk no formal document has captured. Good Fleet Risk Management depends on noticing patterns like this before they become crashes, claims, or injuries.
Where Risk Hides Between Reviews
Scheduled tools such as annual assessments, periodic inspections, and written policies are snapshots. Operations change faster than snapshots. A new customer, a route change, a seasonal surge, a vehicle swap, or staff turnover can alter how drivers work within weeks, long before the next review.
Small adaptations are usually how this starts. A driver shortens a pre-trip check to make a tight window. A dispatcher stops asking whether a route is realistic because it has always worked. Each shortcut is minor and repeated, and eventually it becomes the normal way of doing things. Effective fleet risk management treats those changes as information, asking not just “are we following the plan?” but “what has changed since we wrote it?”
Look at Vehicle, Driver, and Operations Together
Risks are often reviewed in silos: maintenance handles vehicles, safety handles drivers, and dispatch handles schedules. The silos can hide connections.
Consider federal crash research. The FMCSA and NHTSA’s Large Truck Crash Causation Study found that driver-related critical reasons were responsible for 87% of the crashes examined, with vehicle and environmental factors accounting for 10% and 3%. Read quickly, that suggests a driver problem. But the study also tracked “associated factors,” the conditions present around a crash. According to a summary of FMCSA’s analysis, a truck with brake problems was 170 percent more likely to be coded with the critical reason for a crash than a truck without them. The study dates from crashes in the early 2000s, so it shouldn’t be treated as a current snapshot, but its structure is instructive. A “driver error” label can sit on top of a vehicle condition, a schedule, or an unfamiliar route.
The practical takeaway is to review the three streams together:
- Vehicle data: inspection findings, repeat defects, and maintenance trends
- Driver data: incident and near-miss reports, plus what drivers say about conditions
- Operational data: delivery windows, route changes, dock wait times, and late-delivery reasons
If hard-braking reports cluster on one route and that route also has the tightest delivery windows and the highest brake wear, you have one problem with three symptoms, not three separate ones.
Treat Schedule Pressure as a Risk Input
Deadlines shape driving decisions whether or not anyone intends them to. A 2010 NIOSH survey of long-haul truck drivers found that an estimated 73% perceived their delivery schedules as unrealistically tight. That survey is old and focused on long-haul drivers, so it doesn’t describe every operation. The principle carries over: pressure is a measurable condition, not just a feeling.
You can put it on your risk list like any other hazard. Which customers or lanes produce the tightest windows? Where do drivers regularly wait at docks and then rush afterward? Which dispatch decisions most often leave drivers with no margin? Writing these down makes them visible and fixable, such as renegotiating an appointment window or adding buffer to a lane.
Turn Incident Reports Into a Pattern Map
Incident and near-miss reports are one of the best sources of early warning, but only if someone reads them for patterns, not just individual cases. Reports sitting in separate folders rarely reveal that three “minor” events share a location, a time of day, or a vehicle type.
A short, consistent record helps. For each event, capture:
- Where it happened and under what conditions
- When, including time of day and shift
- Vehicle and equipment involved
- Driver tenure and familiarity with the route (without assigning blame)
- Contributing factors the driver identifies
Then review the set regularly. Do the same locations recur? Do newer drivers appear more often on certain routes? Do events spike when a particular customer is on the schedule?
Reporting itself needs attention. NIOSH’s national survey of long-haul drivers estimated that 68% of non-crash injuries among company drivers were not reported to employers. If drivers fear blame, the data will understate the problem. Make reports quick to file, acknowledge them, and show what changed as a result. A non-trucking example of the payoff comes from a CDC-hosted analysis of workplace near misses, which used a common 5 × 5 risk assessment matrix to identify relationships between risk type and corrective action for each near miss. Pattern analysis is what turns reports into decisions.
Prioritize: Not Every Risk Deserves Equal Attention
Once risks are visible, the list can feel endless. Treating every item equally means the serious ones get the same attention as the trivial ones. A common approach is to score each risk on two dimensions: how likely it is to cause harm, and how severe the harm would be. Many organizations then add exposure, meaning how many drivers or trips are affected and how often.
A simple sorting works for most fleets:
- Fix now: high severity and reasonably likely, such as a recurring brake issue on a heavily used route.
- Schedule it: significant but less likely, or those requiring planning, such as revising appointment windows with a customer.
- Monitor: low severity or rare, where you’ll watch for change.
Whatever the system, give each item an owner and a date. Cheap, quick fixes should not wait for the larger ones. In fleet risk management, a short list of risks that gets resolved is worth more than a long list that gets filed.
Keep the Assessment Alive
A risk assessment completed once a year will be out of date by spring. Treat it as a living document with set triggers for revisiting it:
- A new route, customer, or vehicle type
- A cluster of similar incidents or near misses
- Seasonal changes in weather, volume, or staffing
- A change in schedule expectations
Between formal reviews, hold short conversations with drivers and dispatchers about what has changed. They often see the shift first. Some operations also use technology that supports everyday driving safety by supplying trip or event data, and that data is most useful when it feeds these conversations instead of replacing them.
Close the loop. Tell drivers what was found and what changed. When people see that a hazard report led to a fix, they report more.
Conclusion
Formal policies and inspections remain essential, but they capture the fleet as it was on the day they were written. The risks that matter most often develop in between, in drifting habits, shifting schedules, and recurring small events no one has linked together. Fleets that connect vehicle, driver, and operational data, read incident reports for patterns, prioritize by severity and likelihood, and revisit their assessments when conditions change tend to catch problems earlier. Readers interested in further background on commercial driving safety can find additional resources from My Drive Guardian, but the most reliable early-warning system is still a workplace where drivers speak up and managers act on what they hear.
